This guidance sets out how you can use the Data Explorer to find, save and share data.
The Data Explorer is found using the “Tools”tab in the main menu bar.
Data Explorer functions
1 - Search

2 - Filter

3 - Favourite displays your saved favourites

4 - Share a link
Search
Entering a word in the search box returns all the variables that include the search criteria word. This might be in the indicator title, but also in the words used for tagging different indicators. These are not ordered by the importance of the result, so you may need to scroll through the results to find the indicator you are looking for. You may wish to apply some filters before searching, to narrow down your search.
For example, filtering to obtain the Claimant Count by ward returns more than 20 options by age, sex, count and rate. If you only want data for All people, rather than males and females you may want to put the word “total” in the search box to narrow the results.
Top tip! Be specific.
Filter
The “Filter” section allows you to narrow down the list of available indicators by selecting the check boxes under each section. The sections are:
- Theme
- Geography
- Publisher
Expand the list using the down arrows and make your selection, then select Apply. As you select options in this section, the list of indicators in the area below is automatically updated.
For example, if you select “Economy, jobs and benefits” from the “Theme” list, the list expands to show more options for the theme. You can then choose the “Claimants” sub folder, and then “ward” from the Geography filter list. This gives you a list of Claimant Count indicators, with more than 20 different options, by age and sex, with counts and rates listed separately.
Top tip! Filter, filter, filter.
Favourite
You can save your favourite datasets by clicking on the star.
Top Tip! Build a library of your most used datasets.
Share
You can use the “Share” button and it will generate a URL which you can copy and share with colleagues to take them to your selections.
Top Tip! Share a link with colleagues.
Data in the Data Explorer is available only as individual measures. For population data you will find data for the total population, and broad and individual age groups, rather than being able to download a table which includes all the different age groups combined. You may find it easier to download data directly from the ready-made tables and charts which are found in individual area profiles for different topics.
Exploring data

Data Explorer functions
5 - Metadata - a description about the data

6 - Different ways of viewing the data
Metadata describes the data. You can view data as a table, map, time series line chart or a ranked barchart.
Data
The data tab gives you data as a table. Select the geography that you are interested in using the dropdown box. You can download the file in a standard or flat (csv format). You can filter the dates and also select any particular geographical features (see details below).
You can also sort the data in the table by clicking on the column header. Select arrows for ascending or descending sorting.
Map
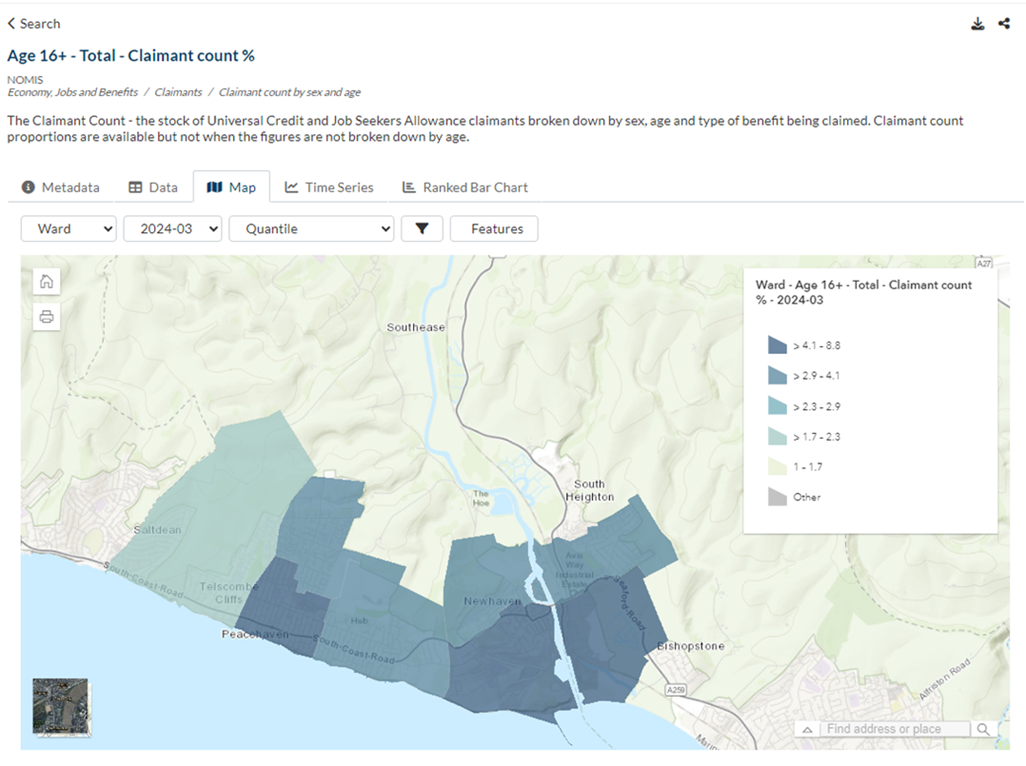
You can select different map intervals. Quantiles (a sample that is divided into equal groups or sizes) are selected in this example. You can filter the dates (9) and also select any particular geographical features (10).

Time series
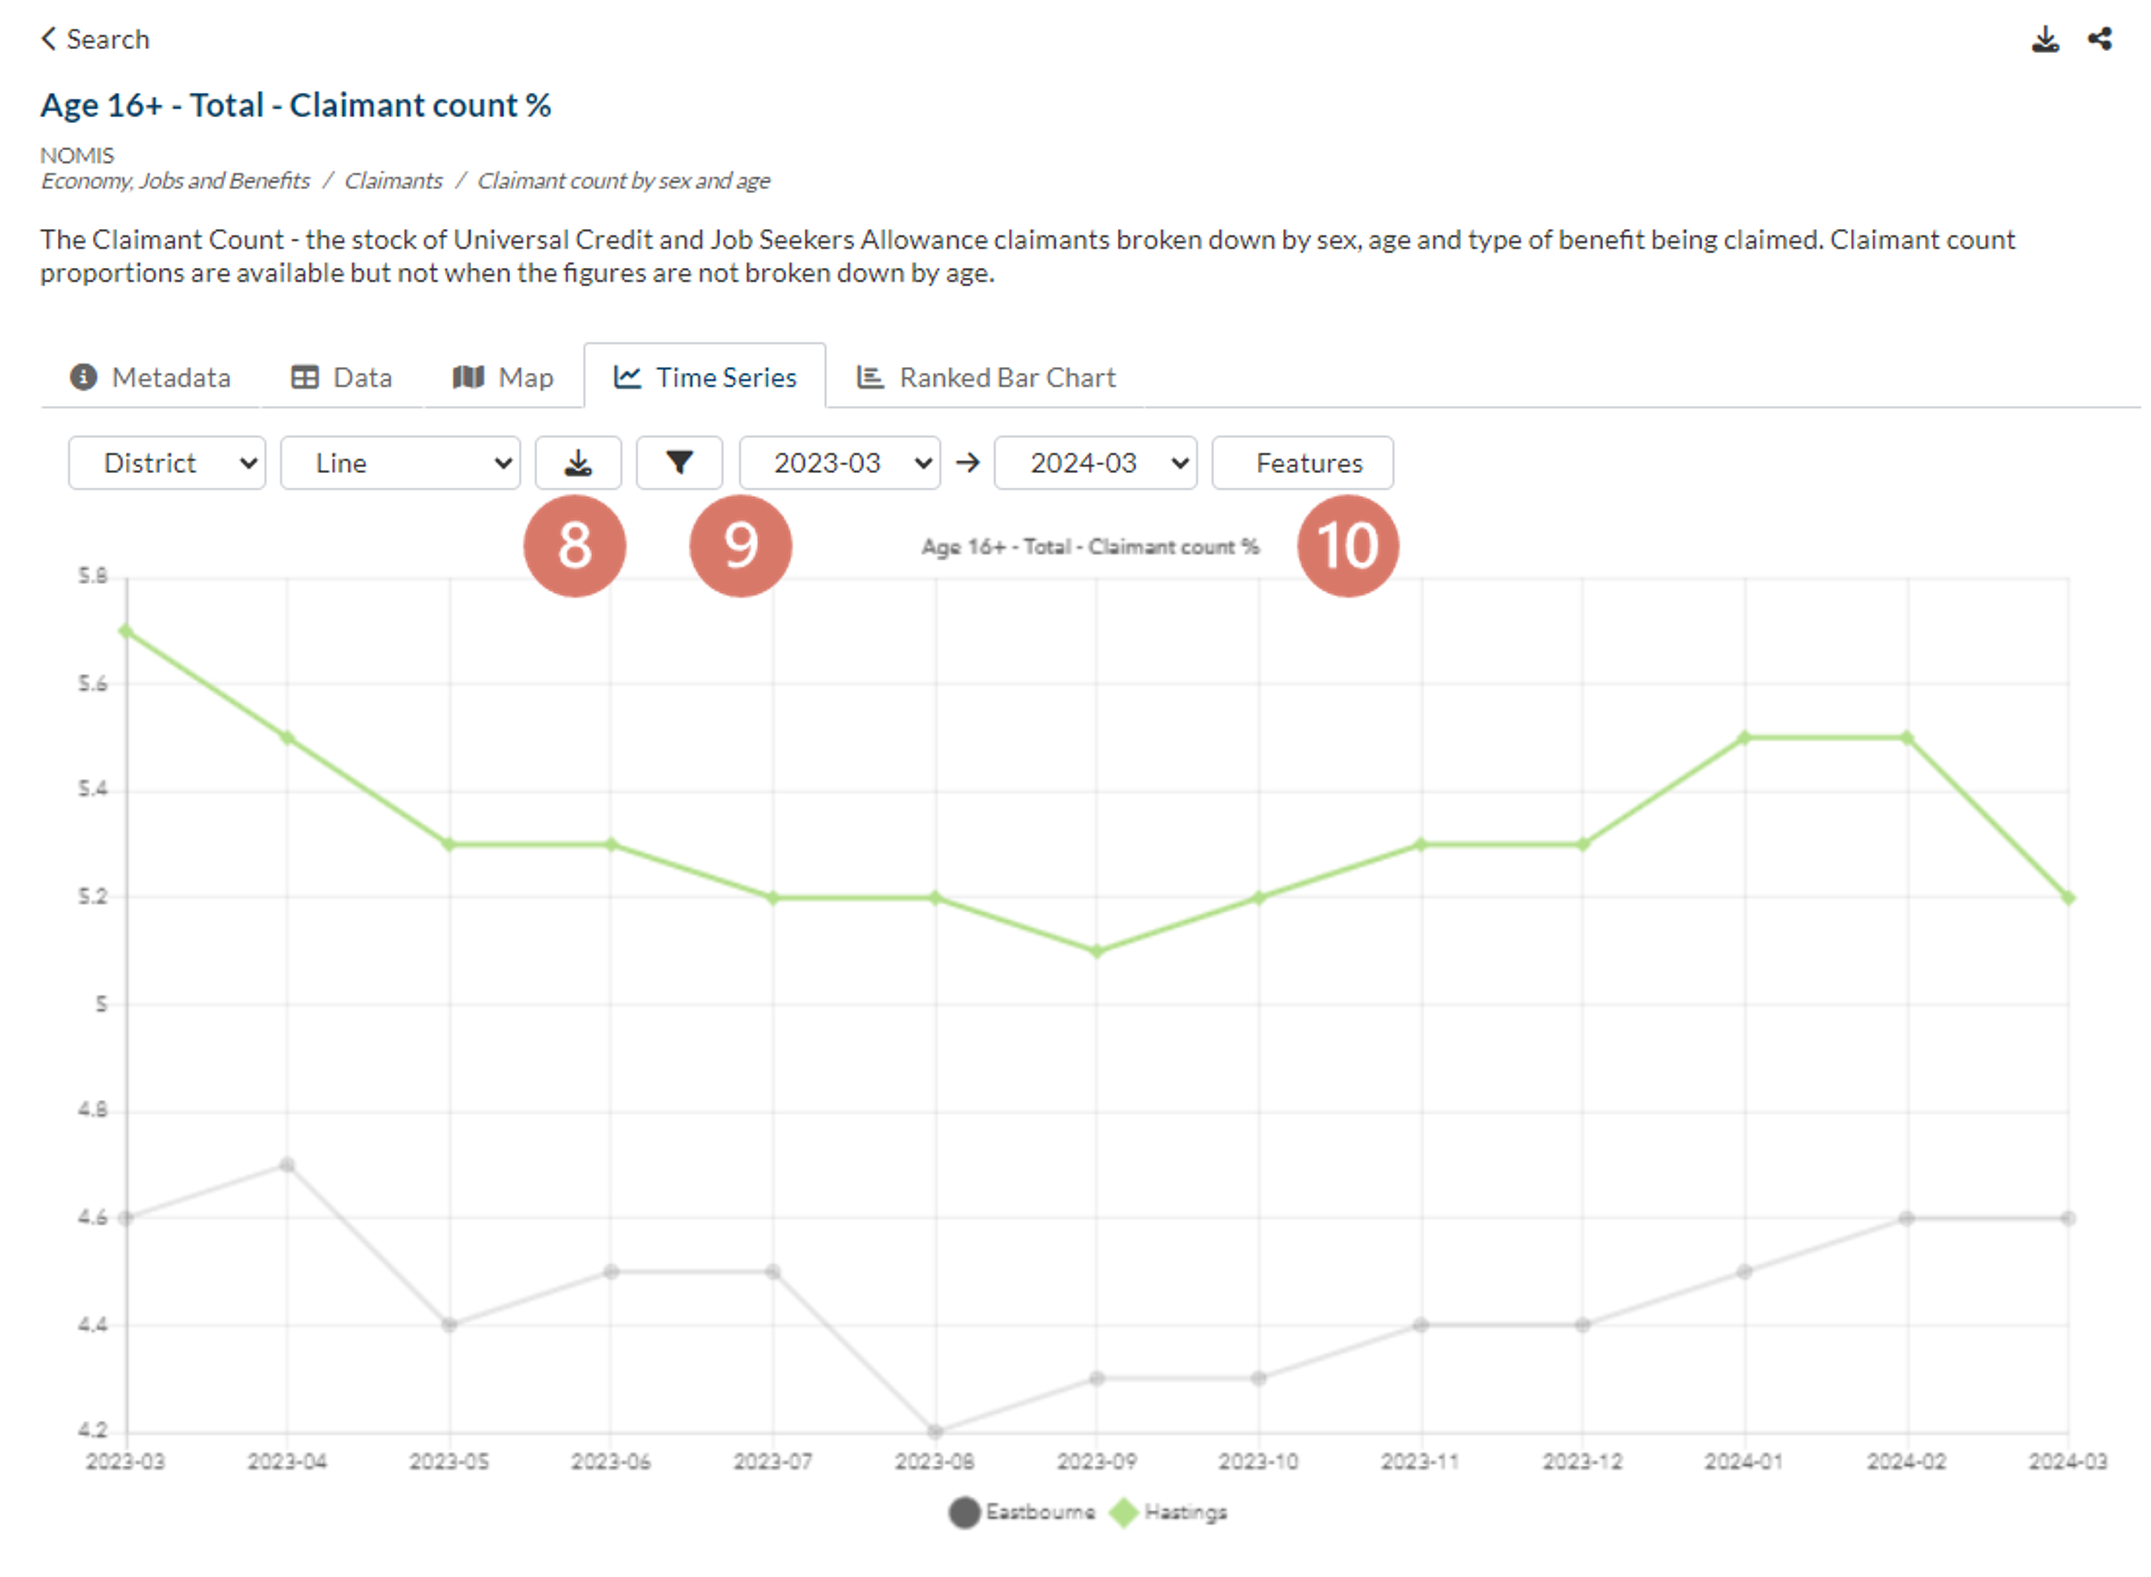
The “Time series” option is useful for seeing a line chart comparing rates in districts or wards, for example. Using the “features” option, you can select specific areas for comparison. Eastbourne and Hastings have been selected in this example. It does not allow you to compare different geographies together (e.g. districts and the county).
Ranked Bar Chart
The “Ranked bar chart” option is useful to look at smaller geographies and compare different areas – you can mouse-over the bars to identify how areas are ranked and see which ranks highest.
Download
You can download all the geographies at once. The download gives data for all the available geographies and this is downloaded into a Zip file of CSVs for each geography.

Data filters and features

Data Explorer functions
8 - Download the particular data view.

9 - Filter data: this symbol toggles the dates and features options on and off.

10 - Select features, e.g. particular geographies.
Top tip! Explore all the options to get the best representation of the story you want to tell.
For further assistance please contact esif@eastsussex.gov.uk


